Gold-Led Melt-Up
...is nothing like a bubble...
TWO THINGS can be true at once, writes Gary Tanashian in his Notes from the Rabbit Hole.
The melt-up going on right now in the precious metals and in certain commodities is subject to downward reaction or correction at any time. But in this new macro (both in market indications and political alignments), it is bullish now and would remain longer-term bullish when said reaction/correction finally does arrive.
That should be reassuring to those investing in the macro as a "new macro" with new rules. Those trading or gaming it are doing what they would have done in the 2001-2022 macro. It's just that now it's a different set of assets and related stock sectors that are screaming higher.
The macro changed, as the chart I use to symbolically illustrate the change showed in real time back in 2022.
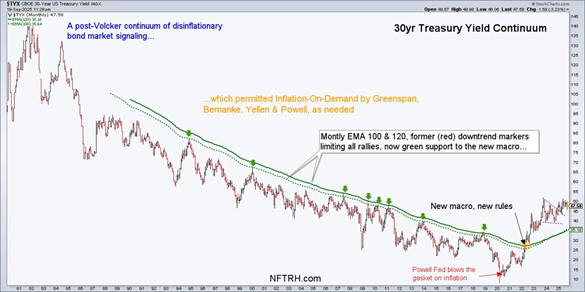
I club you over the head with it repeatedly because I want to club you over the head with things that I find profound. Realizing the gravity of the situation is what allowed us (NFTRH and those subscribers who agreed) to position accordingly.
The Continuum of declining Treasury yields was not the only indicator to the old macro that had been intact but no longer is. But it is a primary one.
That former disinflationary trend is what gave license to monetary policymakers (Fed) to spray the macro with new funny munny at every point of crisis. It also allowed fiscal policymakers (both sides of government) to spray that munny into the economy, to favored areas, at will.
All appeared fine as long as the inflation they systematically created through this policy was working for the cyclical economy and as long as the perception (if not reality) of inflation under control, per the chart, remained intact. It remained intact until 2022. Now? Broken. A new macro for anyone who cares to look, to see.
Personally, I have focused on preferred gold (mainly)/silver stocks, but also a basket of exploration items (see this recent post for the key attributes I look for in these holdings).
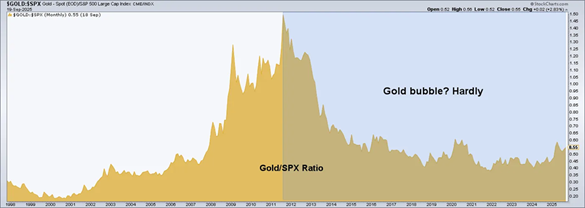
Holdings include miners/producers/explorers of Au, Ag, PGM, REE, Cu, Ni and u3o8. The whole shootin' match has been led by gold. Among the reasons I proclaim that we are only in the early stages of a new macro exist in the phase change per the first chart above (the end of a long era of paper dominance) and in the still extremely moderate basing of gold vs. the headline index of said paper dominance, the S&P 500.
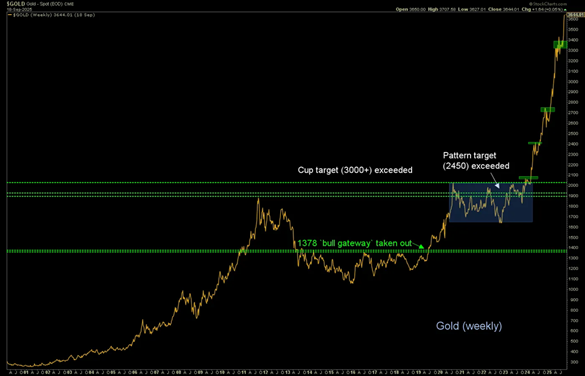
Amazing, gold at $3670 (as I write) and yet the phase change has not even kicked in yet. I used to critique those lathering people up about gold $5,000 or gold $10,000. But only because they were perma-calling during the wrong phase. In 2022, the right phase began and in 2025 it kicked in and became much more obvious.
Refining the view to gold only (the other precious metals and strategic commodities follow through the door that gold has kicked open), it is easy for we TAs to call out "OVERBOUGHT!"
It sure is, on all time frames. The correction in the monetary metal and the metals/minerals and related stocks that followed it will come.
But speaking for myself, I am going to keep the view in mind that the phase has changed, which we knew in 2022. But now we also gain more knowledge each week about the meaning, the nature of the phase change. Hence, we are able to project forward and remain aligned for the long run.
Sure, go ahead and trade. Take profits. I have. But if you tip the scale more as an investor than a daytrader, also keep in mind that the macro we have today is not the macro we had yesterday (yesterday being 2001 to 2022). I am holding favored items, re-balancing (sell a vertical flyer here, buy another preferred item there) but it is also time to hedge, again speaking personally.
Though it's a real bull market, the gains have been unlike anything seen since the brief but spectacular Rocket From The Tombs of the Armageddon '08 crash.
Big picture, gold is a stable long-term asset. A scale weighing value, confidence and gainful economies and markets, or the lack thereof. This is a newer and just as profound macro companion chart to the Continuum above. It speaks for itself, and unless my eyes deceive me, that pattern on the right is not in favor of the king of the previous phase, the S&P 500.
This is not my gold buggery speaking. It's the charts speaking. And there are many more speaking in similar tongues where these came from. From 2008 to 2022 I had to speak of things other than the above in NFTRH. That was the macro we had. Today, it is different. That difference is being presented for all to see.
But the cool part is, gold and its metallic amigos are not making any special kind of noise yet. That is because this big time launch in nominal terms is still being masked by the message of the Gold/SPX chart above. There is no bull market in gold yet. Not in terms of what most people see.
Things should unfold slowly, over several years, subject to perhaps violent corrections, one of which has already been earned. But keeping long-term maps like the charts above in mind can help us see our way through the coming years in good stead.


 Email us