Semiconductor Bubble Goes Very DotCom
More than a shade of 2000 for NVDA, AMD, INTC...
In the PAST YEAR, software stocks have gotten crushed while semiconductors soared, writes Adam Sharp in Addison Wiggin's Daily Reckoning.
In the chart below, we can see that semiconductor stocks (blue) are walloping software (red) in 2026.
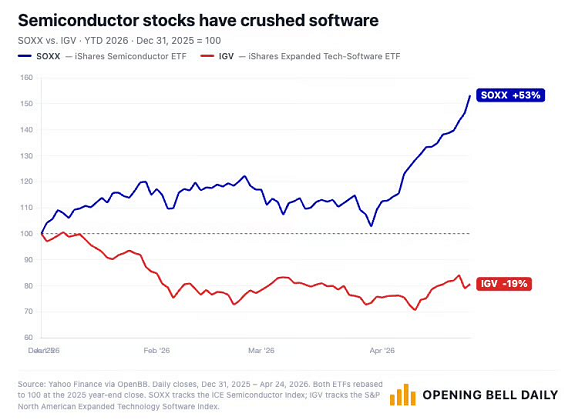
Software stocks include companies like Microsoft (MSFT), Adobe (ADBE), and Figma (FIG). Fears over AI disruption, combined with silly-high valuations, have caused investors to flee the sector.
Meanwhile, all the money is being made in semiconductors (microchips). Companies like Nvidia (NVDA), AMD (AMD), Intel (INTC), Qualcomm (QCOM), are absolutely crushing it.
Semiconductor firms have been the prime beneficiaries of the AI boom. They are the ones selling picks and shovels in this gold rush.
The hottest semi stock lately is Intel (INTC). It has now risen from an August 2025 low of $19 to its current price of $83.54. For decades, the company was a dog. But ever since the US government invested in the company back in August of 2025, it's been on a record-breaking run.
After such incredible performance, semiconductor stocks are getting extremely expensive. Take a look at the chart below, which shows the SOX semiconductor index's price/earnings ratio (blue, left side) and price/book ratio (white, right side).
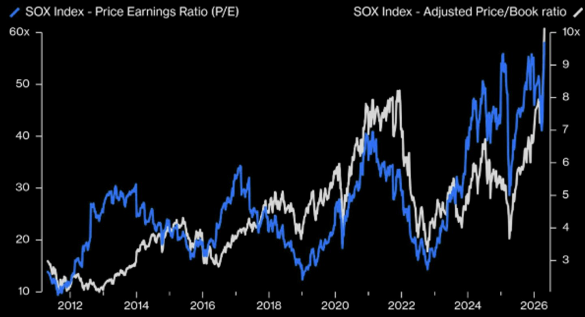
As you can see, semiconductor companies on average are trading at a 60 P/E. And a price/book ratio of 10.
Here's an easy way to think about P/E ratios.
At a P/E of 60, if earnings stayed the same, it would take 60 years for semiconductor stocks to generate profits equal to their market value. That's a long time. Justifying that valuation means counting on decades of high growth ahead.
Could it happen? I suppose anything is possible. But those are some very bubbly numbers. Reminiscent of the dotcom bubble.
Below is a chart comparing the weight of semiconductor stocks over the past 50+ years.
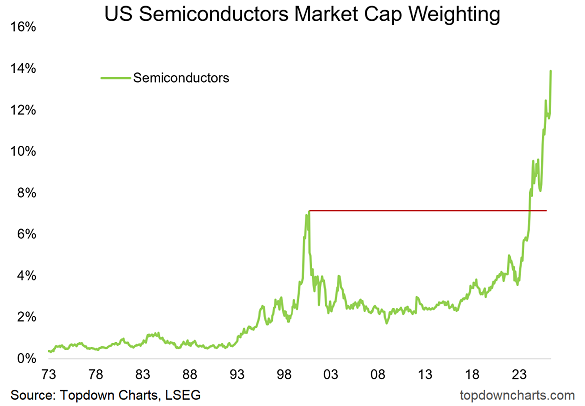
As you can see, chip companies currently make up around 14% of the total stock market value. That's double what they peaked at in 2000.
Semiconductor stocks look highly overbought at this stage. They're now more than 40% above the 200-day moving average. In 2000, it briefly got over 100% of its 200-day moving average. So I suppose we could still have further to go.
But historically, these types of moves end the same way. In a crash.
In 2000, Intel shares reached $75. By 2002, the stock had fallen to a low of around $12. An 83% collapse. Intel just recently surpassed its 2000 peak, 26 years later.
So if you've got a lot of exposure to semiconductor stocks, like Nvidia, Intel, or Qualcomm, now might be a good time to take some profits. Honestly, Nvidia looks like the cheapest of the bunch. But still, when this bubble pops, it'll undoubtedly take a big hit.
I'm confident we'll get a better chance to buy semiconductor/chip stocks sometime in the next 3 years.
Yes, AI is going to play a big role in the future of tech. And that will require a lot of semiconductors. But AI efficiency is improving by leaps and bounds, and eventually chip production will catch up with demand.
Be sure to take some profits before that happens.


 Email us