Silver Price Steadies as Gold Charts 'Signal Consolidation'
GOLD and SILVER steadied on Thursday after halving their price charts' previous gains for the week as the USA and Iran argued whether their 2-week ceasefire deal includes Israel's ongoing war in Lebanon, while Tehran continued to limit oil tanker traffic through the Strait of Hormuz.
Asian and European stock markets fell while interest rates rose in the bond market as crude oil prices rebounded.
The price of silver − which finds more than half its end-user demand from productive purposes led by electrics and solar energy − held close to $75 per Troy ounce, down 3.4% in US Dollar terms from yesterday's 3-week high, reached as the US and Iran confirmed they will attend peace talks hosted by Pakistan this weekend.
Gold meantime rallied to $4766 per Troy ounce today, still 1.8% beneath Wednesday's peak and also now below its simple 50-day moving average − a common indicator in technical analysis of financial price charts − for 3 weeks running, the longest such run since October 2023.
Ending as gold rose following Hamas' 7th October atrocities across southern Israel, that stretch coincided with gold's last drop below its 200-day SMA.
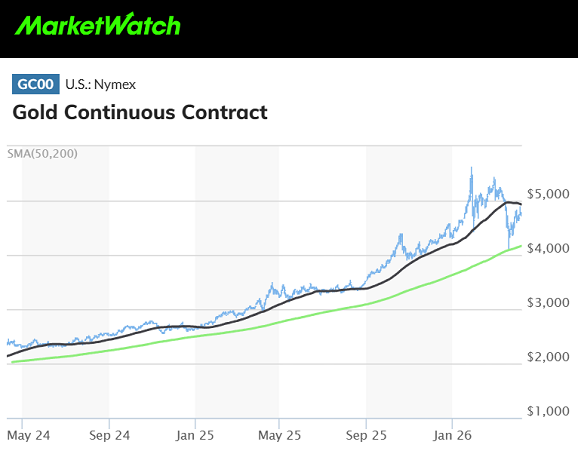
"As the gold price hit the 200-day moving average in March," says analyst Rhona O'Connell at brokerage StoneX, "prices reversed in very heavy spot and forward [trading] activity, prompting a corrective move that...represents a 50% retracement of the fall" from when the war began.
"Gold has stabilised above key support from the long-term 200-day average," agrees technical analysis from the mining industry's World Gold Council, also pointing to how the bottom of March's price plunge marked a "38.2% retracement of the 2022/2025 uptrend", citing what is widely seen as the single most important Fibonacci retracement level.
"With short-term momentum turning higher and with net long positioning [in Comex gold futures and options] also starting to tentatively to rise, our bias remains for the market to see what may be a lengthy consolidation phase develop above here."
Technical analysis today says 'Strong buy' for oil on almost as many chart indicators as it does for gold and silver according to summaries listed by Investing.com.


 Email us